
16. Special Topic: Simple Least Squares Regression in Matrix Form#
Note
This is an optional special topic beyond the required course material, for students who want to see how regression is actually computed by software.
Learning objectives
After this chapter, you will be able to:
Write the simple linear regression model in matrix form \(\mathbf{y} = \mathbf{x}\beta + \boldsymbol{\epsilon}\), and explain the role of the column of 1’s in the design matrix.
Express the least-squares criterion as \(\frac{1}{n}\mathbf{e}^\top\mathbf{e}\) and follow the gradient derivation of the normal equations.
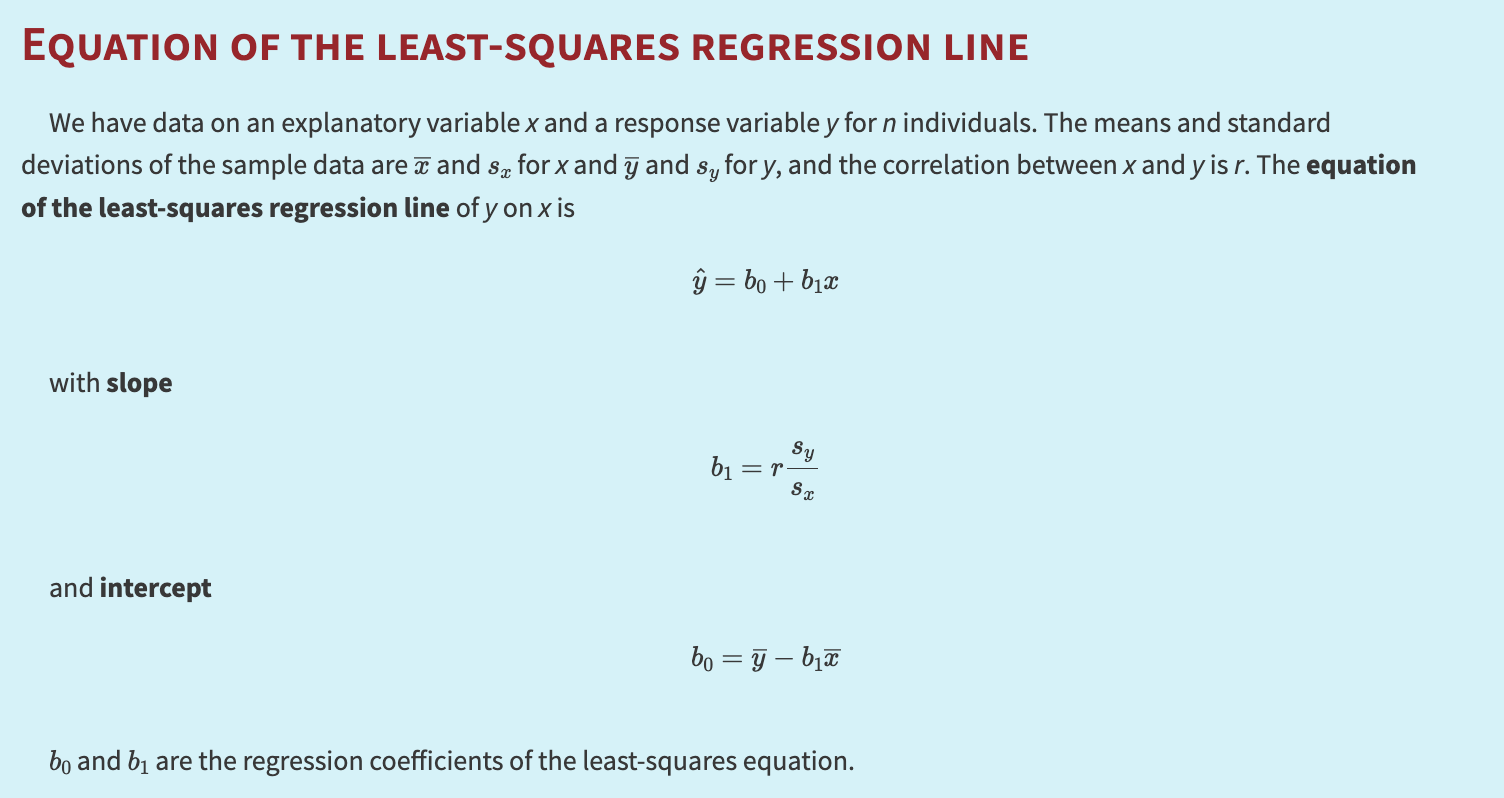
Compute \(\hat{\beta} = (\mathbf{x}^\top\mathbf{x})^{-1}\mathbf{x}^\top\mathbf{y}\) by hand for a small dataset, and verify it matches the familiar formulas \(b_1 = r\,s_y/s_x\) and \(b_0 = \bar{y} - b_1\bar{x}\).
Explain why the matrix formula is the one software actually uses, and why it generalizes to multiple predictors while the \(r\,s_y/s_x\) formula does not.
Where are we? Same regression, one line of linear algebra
Everything in this chapter ends in a single line: \(\hat{\beta} = (\mathbf{x}^\top\mathbf{x})^{-1}\mathbf{x}^\top\mathbf{y}\). Why bother, when we already have \(b_1 = r\,s_y/s_x\)? Two reasons. First, this is literally how software computes it — when you call a regression routine, a matrix expression like this (or a numerically safer cousin) is what runs. Second, unlike the \(r\,s_y/s_x\) formula, the matrix formula generalizes untouched to any number of predictors: add more columns to \(\mathbf{x}\) and the same line still delivers every coefficient. This chapter is the doorway from STAT 301 to real statistical computing.
We have a data set consisting of \(n\) paired observations of the predictor/explanatory variable \(X\) and the response variable \(Y\), i.e., \((x_1, y_1), (x_2, y_2), \dots, (x_n, y_n)\). We wish to fit the model with a regression line:
where we have the assumptions, for each \(\epsilon_i\):
\(\mathbb{E}[\epsilon_i \mid x_1, \dots, x_n] = 0\),
\(\text{Var}[\epsilon_i \mid x_1, \dots, x_n] = \sigma^2\), and
the \(\epsilon_i\) are uncorrelated across measurements.
The parameters are \(\beta_0,\ \beta_1,\) and \(\sigma\).
16.1. The Matrix Representation#
Group all of the observations of the response into a single \(n\times 1\) column vector \(\mathbf{y}\):
Similarly, group the two coefficients into a single \(2 \times 1\) vector:
We also group the observations of the predictor variable:
This is an \(n \times 2\) matrix, where the first column is all 1’s (for the intercept) and the second column holds the actual \(X\) values. Then:
i.e., \(\mathbf{x}\beta\) is the \(n \times 1\) vector of fitted predictions. The matrix \(\mathbf{x}\) is often called the design matrix. Thus:
16.2. Mean Squared Error in Matrix Form#
At each data point, using the coefficients \(\hat{\beta}\) results in some error of prediction, so we have \(n\) such errors forming the vector:
When deriving the least squares estimator, we want to find \(\hat{\beta}\) that minimizes the mean squared error (MSE):
(Note: here “MSE” is the average squared error used as the objective for minimization; it is not the same quantity as the MSE \(= SSE/(n-2)\) used in regression inference. The two differ only by a constant factor, so the minimizing \(\hat{\beta}\) is unchanged.)
In matrix form:
To see this clearly,
16.3. Expanding the MSE Matrix#
Since \(\bigl(\mathbf{y}^\top \mathbf{x}\,\hat{\beta}\bigr)\) is a scalar, we have \(\mathbf{y}^\top \mathbf{x}\,\hat{\beta} = \hat{\beta}^\top \mathbf{x}^\top \mathbf{y}\). Thus:
16.4. Minimizing the MSE#
We first compute the gradient of \(MSE(\hat{\beta})\) w.r.t. \(\hat{\beta}\):
But \(\nabla\,\mathbf{y}^\top \mathbf{y} = \mathbf{0}\) (it’s constant in \(\hat{\beta}\)), so:
Setting this to zero:
Hence,
where \(\mathbf{x}^\top \mathbf{x}\) is invertible provided the \(x_i\) are not all equal.
A very compact result!
Example: the formula by hand, on three points
Take the tiniest interesting dataset: \(x = (1, 2, 3)\) and \(y = (2, 3, 5)\).
Step 1 — Build the design matrix (a column of 1’s, then the \(x\) values):
Step 2 — Compute \(\mathbf{x}^\top\mathbf{x}\) and \(\mathbf{x}^\top\mathbf{y}\). Each entry is a simple sum: \(n = 3\), \(\sum x_i = 6\), \(\sum x_i^2 = 1 + 4 + 9 = 14\), \(\sum y_i = 10\), \(\sum x_i y_i = 2 + 6 + 15 = 23\):
Step 3 — Invert the \(2\times 2\) matrix. The determinant is \(3 \cdot 14 - 6 \cdot 6 = 6\), so
Step 4 — Multiply:
So \(b_0 = 1/3\) and \(b_1 = 1.5\): the fitted line is \(\hat{y} = \tfrac{1}{3} + 1.5\,x\).
Step 5 — Confirm against the familiar formulas. With \(\bar{x} = 2\), \(\bar{y} = 10/3\), \(s_x = 1\), \(s_y \approx 1.528\), and \(r \approx 0.982\):
Identical. The matrix route and the summary-statistics route are the same estimator wearing different clothes — but only the matrix route survives when you add a second predictor column to \(\mathbf{x}\).
16.5. Check Your Understanding#
Suppose we add a second predictor, so the model becomes \(y_i = \beta_0 + \beta_1 x_{i1} + \beta_2 x_{i2} + \epsilon_i\). What changes in the matrix solution \(\hat{\beta} = (\mathbf{x}^\top\mathbf{x})^{-1}\mathbf{x}^\top\mathbf{y}\) — and what would we need for it to still exist?
Remarkably little changes: the design matrix \(\mathbf{x}\) gains one column (it becomes \(n \times 3\): a column of 1’s, then the \(x_{i1}\)’s, then the \(x_{i2}\)’s), \(\beta\) becomes \(3 \times 1\), and the same formula \(\hat{\beta} = (\mathbf{x}^\top\mathbf{x})^{-1}\mathbf{x}^\top\mathbf{y}\) delivers all three coefficients at once — now inverting a \(3 \times 3\) matrix instead of a \(2 \times 2\). The formula \(b_1 = r\,s_y/s_x\) has no such extension; this is exactly why software works in matrix form. For the solution to exist, \(\mathbf{x}^\top\mathbf{x}\) must be invertible, which requires the columns of \(\mathbf{x}\) to be linearly independent — no predictor may be constant or an exact linear combination of the others (in the simple-regression case, this reduces to “the \(x_i\) are not all equal”).